RSI Won 69.8% of Its Trades and Still Lost 27.6%
The pitch vs the data
RSI 30/70 is sold as the simplest edge in trading: buy when it's oversold, short when it's overbought, collect the bounce. The high win rate part is true. Across BTC, ETH and SOL on 1h and 4h charts, this strategy won between 60.0% and 69.8% of its trades.
It also lost money on all six runs.
The rules we tested
- Indicator: RSI(14) on close.
- Long entry: RSI crosses back above 30.
- Short entry: RSI crosses back below 70.
- Exit: when RSI reaches 50. No stop loss, no take profit.
- Fees: 0.05% per side.
- Leverage: 1x.
- Execution: signal evaluated at candle close, position opened at that close. No slippage modelled.
- Data: Binance spot candles, 2025-11-12 to 2026-11-12 (one year). 8,759 bars on 1h, 2,189 bars on 4h.
- Markets: BTCUSDT, ETHUSDT, SOLUSDT.
A note on shorts: the backtest models short positions at 1x. On a pure spot account you can't short, so a long-only version would produce different numbers.
Results
| Pair | Timeframe | Trades | Win rate | Net return (after fees) | Return before fees | Fees paid (% of capital) | Max drawdown | Buy & hold |
|---|---|---|---|---|---|---|---|---|
| BTCUSDT | 1h | 135 | 67.4% | -9.6% | +3.4% | 13.5% | -31.2% | -29.0% |
| BTCUSDT | 4h | 30 | 60.0% | -33.1% | -31.1% | 2.9% | -38.4% | -28.0% |
| ETHUSDT | 1h | 129 | 64.3% | -39.5% | -31.1% | 12.9% | -44.2% | -41.3% |
| ETHUSDT | 4h | 34 | 67.6% | -4.3% | -1.1% | 3.4% | -37.1% | -40.6% |
| SOLUSDT | 1h | 129 | 69.8% | -27.6% | -17.7% | 12.9% | -47.0% | -47.7% |
| SOLUSDT | 4h | 29 | 62.1% | -29.1% | -27.1% | 2.8% | -42.5% | -46.1% |
Context first: all three coins fell over the test year, between -28.0% and -47.7% for a buy-and-hold position. Keep that in mind for everything below.
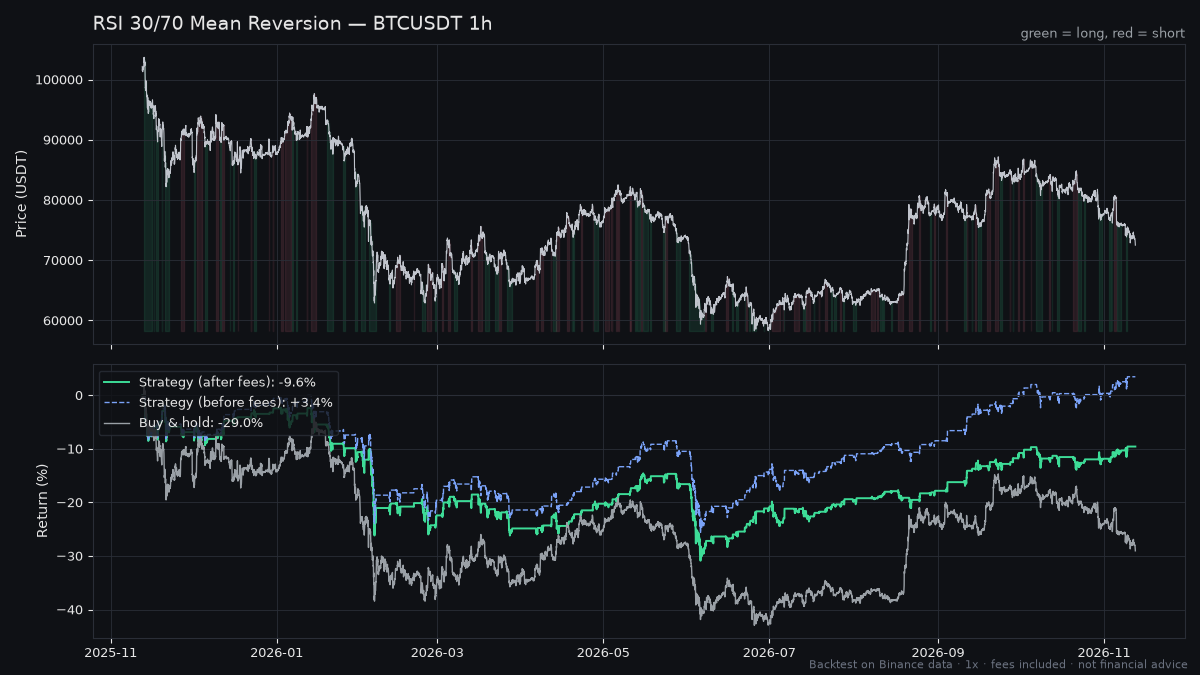
BTC 1h is the most instructive run. It's the only one that made money before fees (+3.4%), and fees turned it into a -9.6% loss.
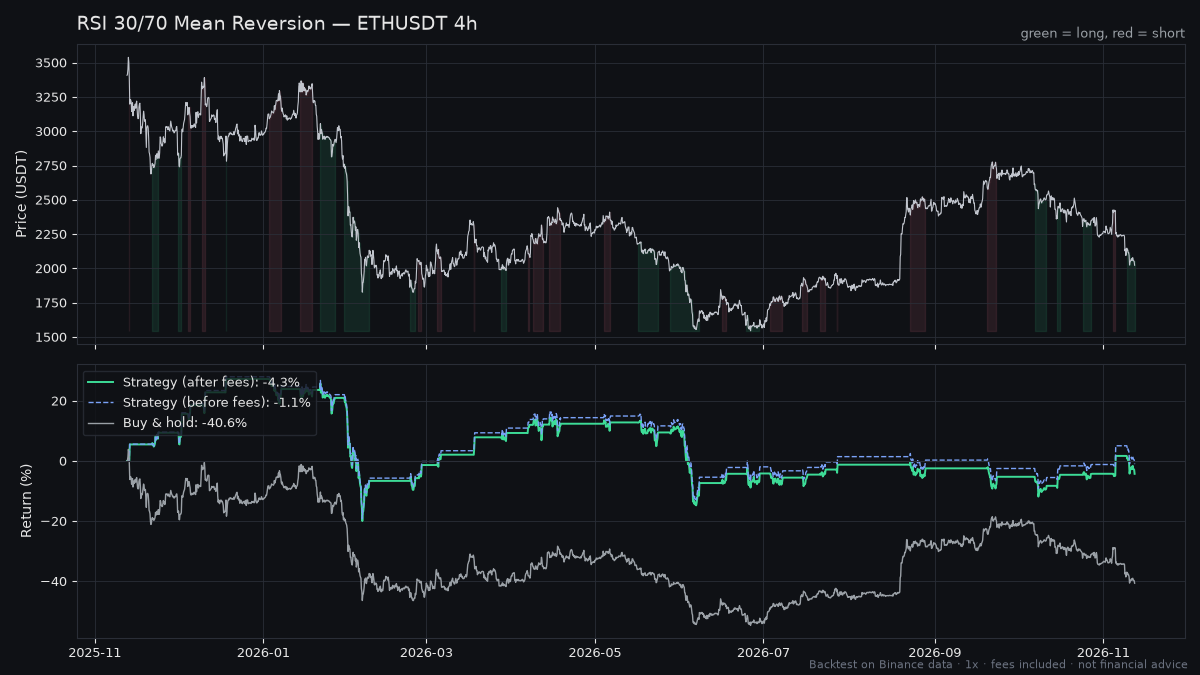
ETH 4h came closest to break-even at -4.3%. It still went through a -37.1% drawdown to get there.
What the numbers actually say
1. A 60%+ win rate means nothing when losses are bigger than wins
Every run won more often than it lost. Every run lost money. The explanation is trade size:
| Run | Win rate | Avg win | Avg loss | Net return |
|---|---|---|---|---|
| BTCUSDT 1h | 67.4% | 0.86% | -1.94% | -9.6% |
| BTCUSDT 4h | 60.0% | 1.7% | -5.47% | -33.1% |
| ETHUSDT 1h | 64.3% | 1.17% | -3.01% | -39.5% |
| ETHUSDT 4h | 67.6% | 2.71% | -5.53% | -4.3% |
| SOLUSDT 1h | 69.8% | 1.22% | -3.47% | -27.6% |
| SOLUSDT 4h | 62.1% | 3.0% | -7.27% | -29.1% |
In every row the average loss is larger than the average win. That's built into the rules: exiting at RSI 50 caps winners at a modest bounce, and with no stop loss, a trade that keeps trending against an "oversold" or "overbought" entry runs until RSI drifts back to 50. The highest win rate in the test, SOL 1h at 69.8%, finished at -27.6%.
2. Fees decide the 1h results
At 0.05% per side, the 1h versions (129 to 135 trades) paid 12.9% to 13.5% of capital in fees over the year. The 4h versions (29 to 34 trades) paid 2.8% to 3.4%.
BTC 1h is the clean example: +3.4% before fees, -9.6% after. The only gross edge in the whole test was smaller than its trading costs. And since no slippage is modelled, live fills would be worse, not better.
3. "Beating buy and hold" here means losing less
Five of six runs finished ahead of buy and hold, and on a couple the gap is large: ETH 4h returned -4.3% against -40.6% for holding, SOL 1h -27.6% against -47.7%. BTC 4h did worse than holding, -33.1% against -28.0%.
But this strategy can go short. In a year when all three coins fell, a long/short system should have had the wind at its back, and it still couldn't post a single positive result. Staying out of the market entirely would have beaten every run. Sharpe ratios tell the same story: negative everywhere except ETH 4h at 0.03, which is effectively zero.
4. Drawdowns were as deep as just holding the coin
Max drawdown ranged from -31.2% (BTC 1h) to -47.0% (SOL 1h). SOL 1h's -47.0% drawdown is nearly the same as SOL's full-year buy-and-hold loss of -47.7%. ETH 4h, the best run, still dipped -37.1%.
These are 1x numbers. Leverage multiplies drawdowns along with returns, so any leveraged version of this setup would have been considerably worse.
How to test it yourself on TradingView
- Open a BINANCE:BTCUSDT, ETHUSDT or SOLUSDT spot chart on the 1h or 4h timeframe.
- Open the Pine Editor, paste the script below and click "Add to chart".
- The script sets commission to 0.05% and fills orders on bar close, matching our assumptions. Check both in the strategy's Properties tab.
- Set the date range to 2025-11-12 to 2026-11-12 to compare with our table, then extend it to see whether a different market regime changes the picture.
- In the Strategy Tester, look at average win vs average loss next to the win rate, not just the headline profit.
//@version=5
strategy("RSI 30/70 Mean Reversion", overlay=false, process_orders_on_close=true, commission_type=strategy.commission.percent, commission_value=0.05, default_qty_type=strategy.percent_of_equity, default_qty_value=100)

r = ta.rsi(close, 14)

if ta.crossover(r, 30)
    strategy.entry("Long", strategy.long)
if ta.crossunder(r, 70)
    strategy.entry("Short", strategy.short)

if strategy.position_size > 0 and r >= 50
    strategy.close("Long")
if strategy.position_size < 0 and r <= 50
    strategy.close("Short")

plot(r, "RSI")
hline(70)
hline(50)
hline(30)
Expect small differences from our numbers: TradingView's data feed, start point and handling of the first bars won't match ours exactly.
Verdict
As tested, RSI 30/70 mean reversion is not something we'd trade. It lost on every coin and both timeframes, the one gross edge (BTC 1h, +3.4%) was eaten by fees, and drawdowns were about as deep as holding the coin outright. If you want to keep working on it, start on 4h, where fees cost 2.8% to 3.4% of capital instead of 12.9% to 13.5%, and test two changes: a hard stop loss aimed at the -5.47% to -7.27% average losers, and a trend filter so the system isn't buying "oversold" in a downtrend. Treat any improvement as a hypothesis until it holds up on a period you didn't tune on. One year of data in one falling market is a thin sample.
FAQ
Does RSI work for crypto trading? Not as a standalone 30/70 mean-reversion system in our test. On BTC, ETH and SOL, 1h and 4h, from 2025-11-12 to 2026-11-12, it won 60.0% to 69.8% of trades and lost money on all six runs after 0.05% fees per side.
Why does a high win rate RSI strategy lose money? Because the losers are bigger than the winners. Exiting at RSI 50 takes small profits, while trades that go wrong have no stop and can keep running. On BTC 1h the average win was 0.86% and the average loss -1.94%, which turned a 67.4% win rate into a -9.6% return.
What are the best RSI settings for crypto? We only tested the default RSI(14) with 30/70 levels, so this data can't name better settings. Be cautious with anyone who can: tuning levels on one year of history risks fitting noise. Test any change on a period you didn't optimize on, with fees included.