UT Bot Alerts Lost Up to 55.9% in Our Backtest. Here's Why
The claim vs the data
UT Bot Alerts is sold as a clean buy/sell signal that keeps you on the right side of the trend. We ran it on one year of Binance data for BTC, ETH and SOL on 1h and 4h candles. After fees, all six runs lost money, and five of six did worse than simply holding coins that themselves fell between 28.0% and 47.7%.
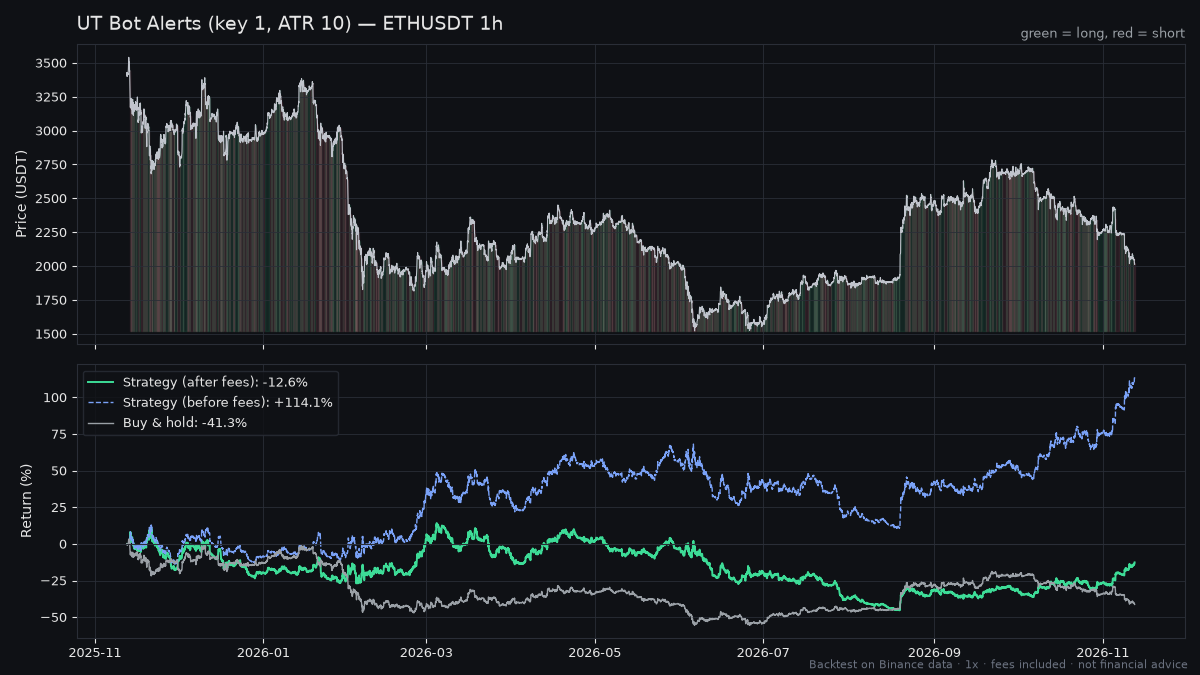
The most interesting number is on ETH 1h: +114.1% before fees, -12.6% after.
The rules we tested
- Indicator: UT Bot Alerts, key value 1.0, ATR period 10.
- Long: on a UT Bot buy signal (price crosses above the ATR trailing stop).
- Short: on a UT Bot sell signal (price crosses below the ATR trailing stop).
- Always in the market: every signal flips the position from long to short or back.
- Execution: signal evaluated at candle close, position opened at that close. No slippage modelled.
- Fees: 0.05% per side.
- Leverage: 1x.
- Data: Binance spot candles from the public market data API, 2025-11-12 to 2026-11-12 (8,759 bars on 1h, 2,189 bars on 4h).
- Markets: BTCUSDT, ETHUSDT, SOLUSDT.
Results
| Symbol | Timeframe | Trades | Win rate | Net return (after fees) | Return before fees | Fees paid (% of capital) | Profit factor | Max drawdown | Buy & hold |
|---|---|---|---|---|---|---|---|---|---|
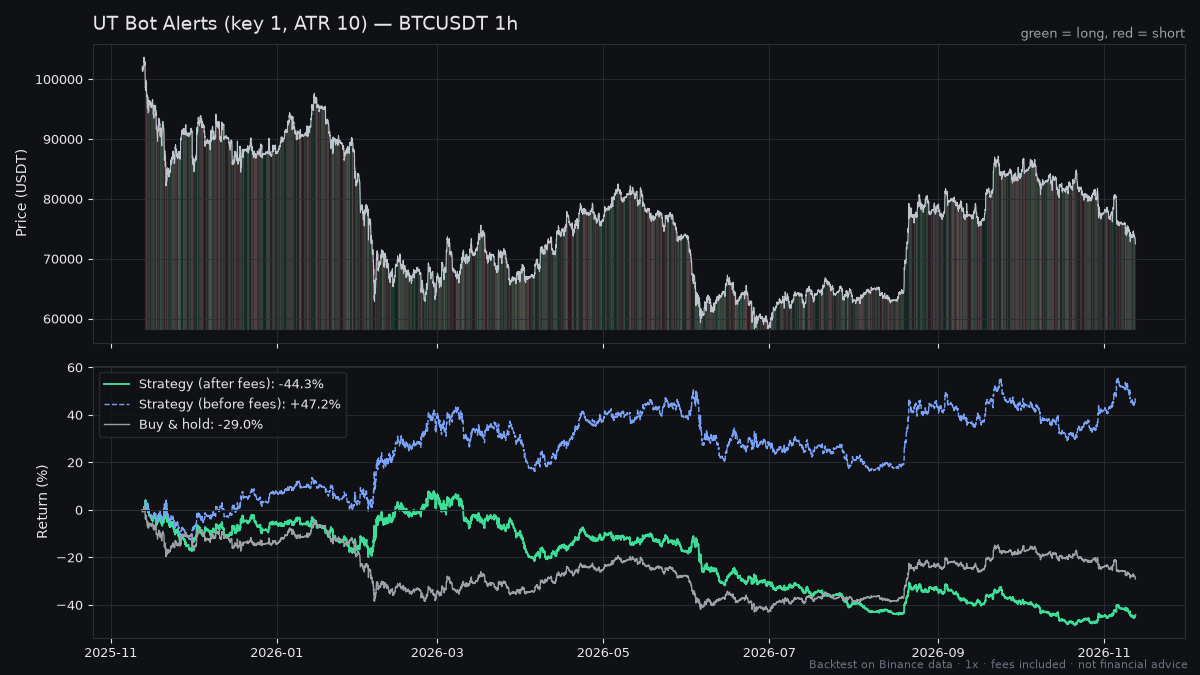
| BTCUSDT | 1h | 965 | 33.6% | -44.3% | +47.2% | 96.4% | 0.90 | -52.4% | -29.0% |
| BTCUSDT | 4h | 237 | 33.8% | -41.1% | -25.2% | 23.6% | 0.82 | -54.8% | -28.0% |
| ETHUSDT | 1h | 889 | 35.1% | -12.6% | +114.1% | 88.9% | 1.01 | -52.1% | -41.3% |
| ETHUSDT | 4h | 235 | 33.6% | -48.8% | -35.0% | 23.5% | 0.85 | -63.8% | -40.6% |
| SOLUSDT | 1h | 971 | 33.2% | -55.2% | +19.3% | 97.0% | 0.91 | -66.4% | -47.7% |
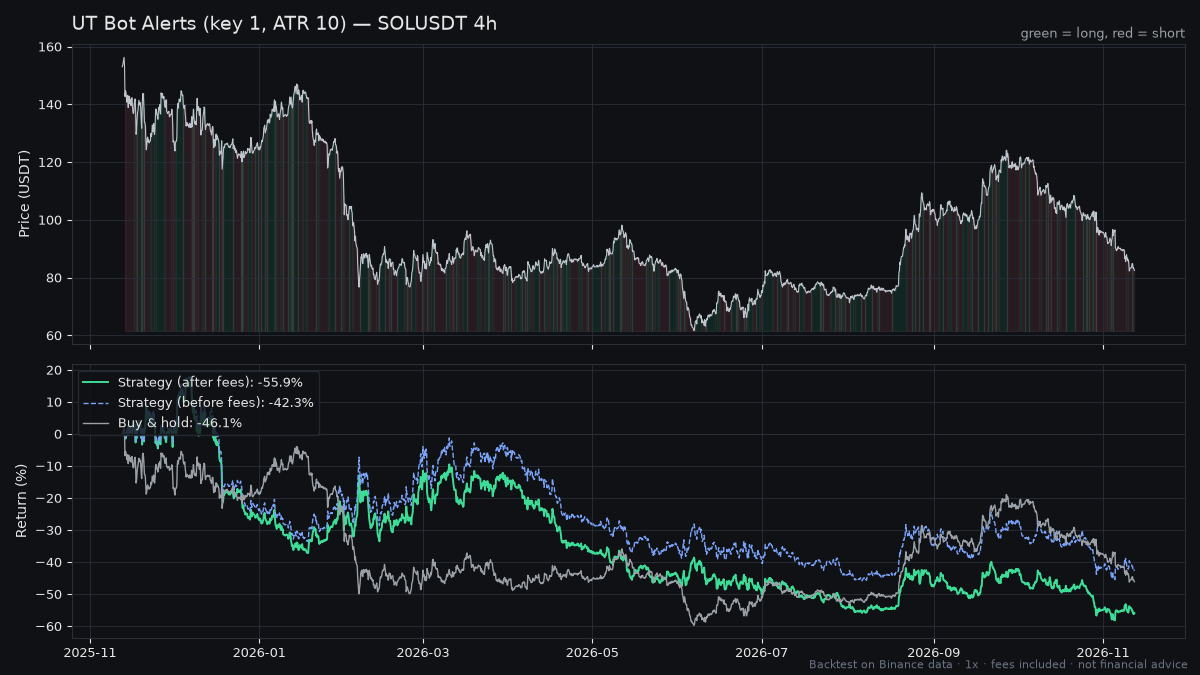
| SOLUSDT | 4h | 265 | 36.6% | -55.9% | -42.3% | 26.4% | 0.83 | -64.0% | -46.1% |
ETH 1h is the clearest picture of what happened: a strategy that made money on paper and handed it all to fees.
BTC 1h tells the same story with a worse ending: +47.2% before fees, -44.3% after.
SOL 4h was the worst run overall, and it lost even before fees.
What the numbers actually say
1. A one-in-three win rate can work. Here it didn't. Win rates ranged from 33.2% to 36.6%. That is normal for a trend follower, and the average win was bigger than the average loss in every run (BTC 1h: +1.3% vs -0.73%; ETH 4h: +3.56% vs -2.12%). But the gap wasn't wide enough. Profit factor was between 0.82 and 0.91 in five runs. ETH 1h scraped 1.01, which is break-even per trade, and still compounded to -12.6%.
2. Fees are the whole story on 1h. All three 1h runs were profitable before fees: BTC +47.2%, ETH +114.1%, SOL +19.3%. With 889 to 971 trades in a year, a 0.05% fee per side added up to 88.9% to 97.0% of capital, and every one of them finished negative. The signal on 1h was not random. It just traded far too often to keep any of its edge.
3. 4h cut the fees but had no edge to protect. Moving to 4h dropped trade counts to 235-265 and fees to 23.5%-26.4% of capital. The problem is the 4h runs lost before fees too: -25.2% on BTC, -35.0% on ETH, -42.3% on SOL. Fewer trades only helps if the trades are good.
4. It lost to buy & hold in a falling market. This was a down year: buy & hold returned -28.0% to -47.7%. An always-in, long-and-short system should have had its best shot here. Only ETH 1h beat holding (-12.6% vs -41.3%). The other five did worse than just sitting on the coin, for example BTC 1h at -44.3% vs -29.0%.
5. The drawdowns are brutal at 1x. Max drawdown ran from -52.1% to -66.4%, and Sharpe ratios were between -1.1 and 0.07. These are unleveraged numbers. Leverage multiplies drawdowns too, and at these depths even modest leverage would put an account at risk of liquidation.
How to test it yourself on TradingView
- Open BTCUSDT (Binance spot) and set the chart to 1h or 4h.
- Add the community script UT Bot Alerts. Set Key Value to 1 and ATR Period to 10. Leave Heikin Ashi signals off; we used regular candles.
- The popular version is an indicator, so it shows signals but no P&L. Use a strategy version of the script, or convert it: enter long on the buy signal, enter short on the sell signal, so each signal reverses the position.
- In the strategy properties, set commission to 0.05%, order size to 100% of equity, and no pyramiding. Make sure orders fill on bar close.
- Set the date range to 2025-11-12 through 2026-11-12, then run it once with commission at 0 and once at 0.05%. The gap between the two is the lesson of this article.
- Remember our test models no slippage, so live results would likely be worse, not better.
Verdict
UT Bot Alerts with key 1 and ATR 10, run as an always-in long/short system, lost money on every coin and timeframe we tested, and lost to buy & hold in five of six runs. We would not use it like this. The one genuinely useful finding is that the 1h signal had a gross edge on all three coins before costs, so the problem is overtrading, not pure noise. If you want to keep exploring it, the things worth testing are a wider key value (a wider stop means fewer flips), a higher-timeframe trend filter, or using UT Bot only as a trailing exit rather than a reversal signal. We haven't tested those yet, so treat them as hypotheses, not fixes.
FAQ
Is UT Bot Alerts profitable for crypto? Not with the default-style settings we tested. Using key 1 and ATR 10 on BTC, ETH and SOL over 2025-11-12 to 2026-11-12, all six runs lost money after 0.05% fees per side, with net returns from -12.6% to -55.9%.
Is UT Bot better on the 1h or 4h chart? Neither was profitable after fees. 1h had the better raw signal (profitable before fees on all three coins) but paid 88.9%-97.0% of capital in fees. 4h paid far less in fees but lost even before them.
What UT Bot settings should I use? We only tested key 1 and ATR 10, so we can't name a best setting. Mechanically, a higher key value widens the trailing stop and produces fewer signals, which would reduce the fee drag that sank the 1h runs. Backtest any change with fees included before trusting it.